You can find temperature, pressure and dust diagrams of Mars, from data taken from one Mars year during AD 1999-2001, by the MGS TES instrument. For comparison, you can also find diagrams using Viking-2 (1976-78) data. We used the vanilla software to get these data from the raw TES datafiles.
For educators: please see our description page for more details.
For the diagrams we have developed a simple 56-sol/month Mars Calendar.
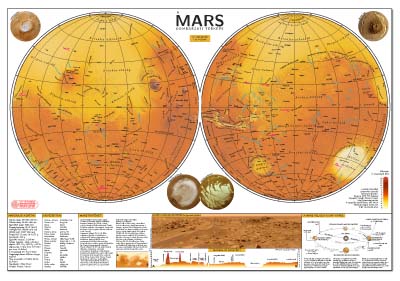
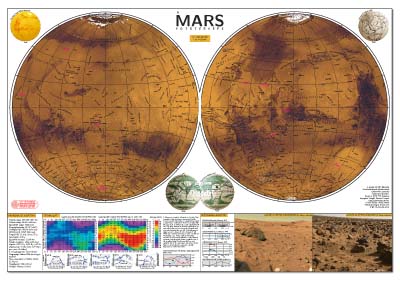
MAPS. If you need help finding a surface feature, go to our map page of if you prefer maps in hemisphere format or a photomap, go to our map publications page.