Mars climate zone map based on TES data
H. Hargitai
Climate zones fist have been defined by
Wladimir Köppen based on the distribution of vegetation groups [1]. Climate
classification is furthermore based on temperature, rainfall, and subdivided
based upon differences in the seasonal distribution of temperature and
precipitation; and a separate group exists for extrazonal climates like in high
altitudes. Mars has no vegetation, nor rainfall so any climate classification could
be only based upon temperature; a further refinement of the system may be based
on dust distribution, water vapor content, occurrence of snow. Climate zone
maps are not continuous as the original datasets are: they are interpreted
(generalized, simplified, classified). This way they make the climate system
easier to understand, emphasizing its important characteristics, omitting the
less important ones.
Solar climate zones. There are several resemblances
in the climate of Mars and Earth [2]. Temperature based climate zones are basically
determined by the current axial tilt and solar radiation, therefore the
simplest climate zone map shows solar climate zones which does not take topography,
albedo, or the atmosphere into account. The Polar zones’ boundaries are defined
by the Arctic and Antarctic Circles (64.9°), the Transitional Zones further by
the Tropic of Pisces (corresponding to the Tropic of Cancer) in the North and
the Tropic of Virgo (corresponding to the Tropic of Capricorn) in the South
(25.1°). The Equatorial Zone is in between the Tropics. (Fig. 1.)
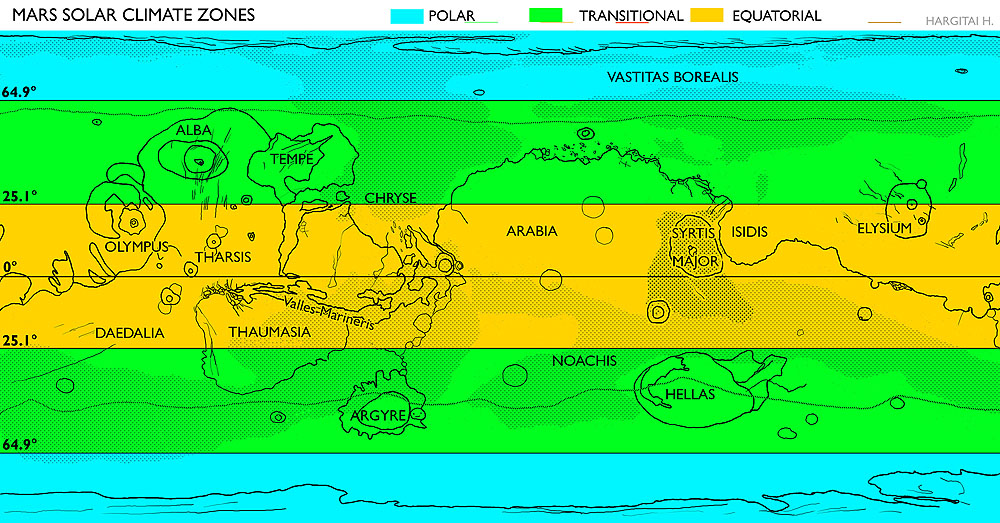
Fig.
1. Solar climate zones of Mars. Explanation
of the base map: dotted line shows seasonal maximum frost extent; continuous
lines show approximate boundaries of geographical features (they are not
automatically generated contour lines), dotted areas show current approximate
extent of dark sand cover (low albedo) from MGS images. Linear features are
fossae or valles; and the polar cap’s topographic
(not permanent ice) boundaries.
Solar
climate zones are moving north/south as seasons progress and the Thermal
Equator moves. North-South seasonal differences caused by orbital excentricity
make summer and winter different on the two hemispheres, therefore the two
hemispheres’ climate zones are not equivalent: southern hemisphere is more extreme,
sublimating more CO2 during the summer and creating higher pressure, therefore giving birth to
stronger winds are more dust storms. However, southern winter is colder because
of larger distance from the Sun (Fig. 2, 3, 4). Asymmetry in the southern polar
zone is related to the asymmetric shape of the southern permanent ice cap.
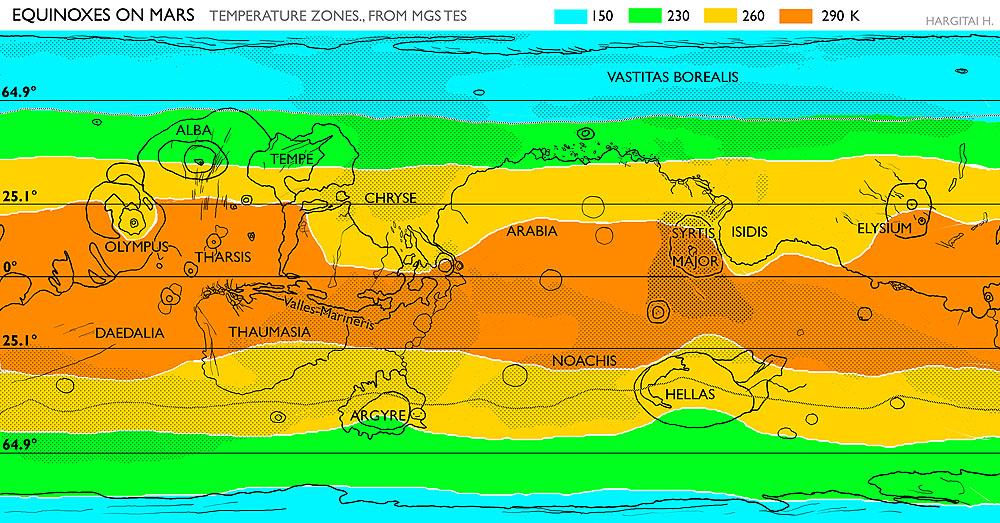
Fig.
2. Spring and Autumn Equinox (Ls=0, 180) temperature zone patterns modified by
albedo and topography (Temperature values correspond to daytime maximums)

Fig.
3. North Winter Solstice (Ls=270) temperature zone patterns modified by albedo
and topography and actual radiation

Fig.
4. North Summer Solstice (Ls=90) temperature zone patterns modified by albedo
and topography and actual radiation
The actual climate pattern is much less complex that on
Earth since global circulation (two Hadley cells during spring/autumn, one
during summer/winter [3,4]) is more simple, there are no oceans and oceanic currents
etc. The solar climatic zones are modified by topography, albedo and the
presence of seasonal or permanent ice, wind patterns and the topographic dichotomy.
Surface phenomena like dust devil tracks, crater wind tails are indicators of
wind directions. Low albedo surfaces covered by darker sand grains has higher thermal
inertia than brighter areas. Topographic lows (basins) and highs (mountains)
have a topography-determined climate zone (Fig. 5.). Lowland climates are
characterized by frequent fog, having a brighter average albedo.
Climate zones of Mars.
Our Climate
Zone Map is using temperature,
albedo and topographic data combined with the data on the extent of permanent
ice caps and the maximum seasonal extent of frost cover.

Fig.
5. Mars Global Climate Zones, based on temperature, modified by
topography,
albedo, actual solar radiation. A=Glacial
(permanent ice cap); B=Polar (covered
by frost during the winter which sublimates during the summer); C=North
(mild) Transitional (Ca) and C South (extreme) Transitional (Cb); D=
Tropical; E= Low albedo tropical; F=
Subpolar Lowland (Basins); G=Tropical
Lowland (Chasmata); H=Subtropical
Highland (Mountain)
The temperature
profiles of the particular climate zones can be represented by actual climate
diagrams [5]
Climate zones and surface features. An analogue method
with Köppen’s vegetation based classification system is to consider surface
feature types as indicators of a climate zone. Climate zones are reflected by
the current surface processes and features. However, visible surface features
like valleys may reflect paleoclimatic zones of various ages [6,7]; reflecting
changes in rotational axis and the atmospheric dust content for features few million
years old (these include gullies, spiders, ephemeral flow-like features on
steep dune slopes; polar caps, polygons); and considerable changes in atmospheric
water vapor content, subsurface water, atmospheric pressure and temperature for
very old (several Ga) features (including
valley networks, channels, crater lakes) [8]. Those which reflect current
climatic conditions are or have been recently active. Out future work is to
combine zones defined by the distribution of specific landform types; temperature
and dust (storm activity); wind directions, intracrater ice/frost and snowfall [9], forming a
more complex classification system for the climatic zones of Mars; as part of
the ICA Commission of Planetary Cartography activities [10]. Full resolution
maps are available at http://planetologia.elte.hu
References
[1] Köppen, W. (1931).
Klimakarte der Erde. Berlin and Leipzig. [2] Kereszturi Á. (2007)
Légkör 52/2, 12-17., 52/3, 6-9. [3] M. M. Joshi, R. M. Haberle, J.
Schaeffer and J. Barnes (1997). Advances
in Space Research 19, 8, pp. 1261-1265 [4] Mark I. Richardson and R.
John
Wilson (2002). Nature 416, 298-301 [5]
H. Hargitai, Sz. Bérczi, Sz. Nagy, A. Gucsik, Á. Kereszturi (2008) LPSC
XXXIX
#1476 [6] Mizser, Kereszturi (2007) LPSC XXXVIII #1523, [7] Kereszturi
Á (2008)
3rd Planetology Seminar, Budapest,
#D3 [8] Kereszturi A (2010): Gullies, spiders and various small flow
features
for climate reconstruction – idea for complex map generation. LPSC 41,
this volume. [9] Homolya, E, Sz. Bérczi (2010) Snowings in
the Solar System. LPSC 41, this volume.
[10] Shingareva, Kira B.; J. Zimbelman, M. F. Buchroithner, H. I.
Hargitai
(2005) Cartographica, 40, 4 Winter
105-114.